Hotel Price Prediction With Data Analysis & Machine Learning
April 17, 2023

RESEARCHED POC ON HOTEL PRICE PREDICTION
The purpose of this research is to understand the potential of traditional and non-traditional statistical techniques to predict dynamic hotel room prices. Four forecast models were employed: Linear Regression, the Random forest, the Extreme Gradient Boosting(XG boost), is a scalable, distributed gradient-boosted decision tree (GBDT), and the Decision tree. This research is based on an empirical study of data obtained from the Choice Property Management System(PMS)for the property named “Comfort Inn & Suites” for the year 2021,2022.
The economic predictors were obtained from other reliable sources such as the World Tourism Organization. This study agreed with existing literature on the ability of machine learning to predict hotel room prices precisely. Given the complexity of the hotel industry, the effect of external economic predictors was tested in the model. The challenge lay in dealing with the mixed frequencies observed in the collected data. This is designed to add an innovative approach to the existing literature on machine learning in the hotel industry. This creates a bridge between many academic disciplines such as computer science, economics, and marketing. Hotel operators should benefit from this research when setting strategies as well as in using the model to set their relative room prices.
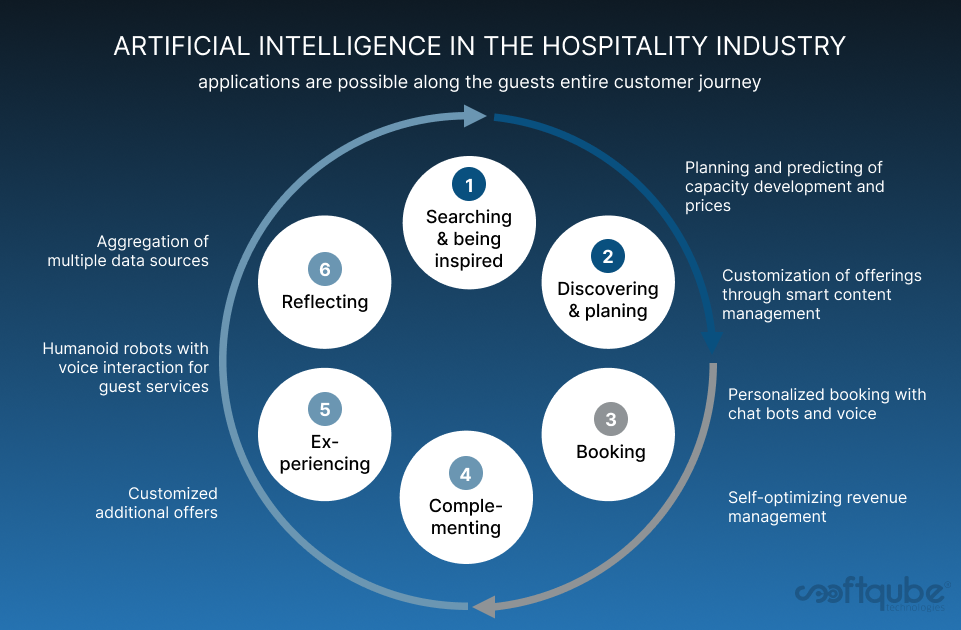
The hospitality business has several variables to take into account when determining the optimal price for hotel rooms and other property services. Evaluating demand for accommodation and pricing rates can enable business to have clear idea of when they will experience high demand and accordingly charge high rates. To deal with this, we have built a machine learning model that can predict hotel prices as well as tools and methodologies for analyzing historical hotel data. This allows to maximize revenue during peak seasons and better management of resources.
STEPS TAKEN
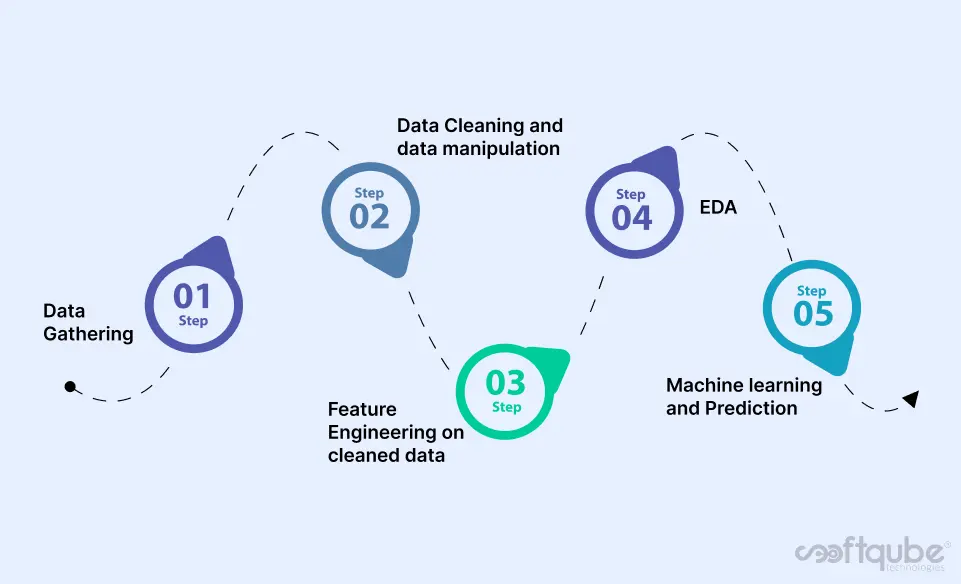
DATA GATHERING
We get the sample data from one of the PMS system named “Choice PMS”, in our case it was easy to get the data but some times it becomes lot more hard to acquire relatable data from authentic sources.
DATA CLEANING AND DATA MANIPULATION
Data Cleaning means the process of identifying the incorrect, incomplete, inaccurate, irrelevant or missing part of the data and then modifying, replacing or deleting them according to the necessity. Data cleaning is considered a foundational element of the basic data science.
FEATURE ENGINEERING
Feature engineering is the act of converting raw observations into desired features using statistical or machine learning approaches with the goal of simplifying and speeding up data transformations while also enhancing model accuracy.
EDA (EXPLORATORY DATA ANALYSIS)
Exploratory Data Analysis (EDA) is an approach to analyse the data using visual techniques. It is used to discover trends, patterns, or to check assumptions with the help of statistical summary and graphical representations.
MACHINE LEARNING
Machine learning model predictions allow businesses to make highly accurate guesses as to the likely outcomes of a question based on historical data, which can be about all kinds of things – customer churn likelihood, possible fraudulent activity, price prediction and more. These provide the businesses various insights that result in tangible business value.
SAMPLE DATA

- This is Raw data on which we worked on and performed data cleaning and Feature engineering.
- Effective data cleaning is a vital part of the data analytics process.
- Here is the snapshot of Final data frame, which will be using for further data analysis. It’s about 31445 rows and 17 columns.
- Here you can see we extracted new columns, removed duplicate values, unwanted outliers, extracted features and manipulated values.
DATA ANALYSIS
- Here we tried to analyse data and understand flow throughout data, patterns and trends in it.
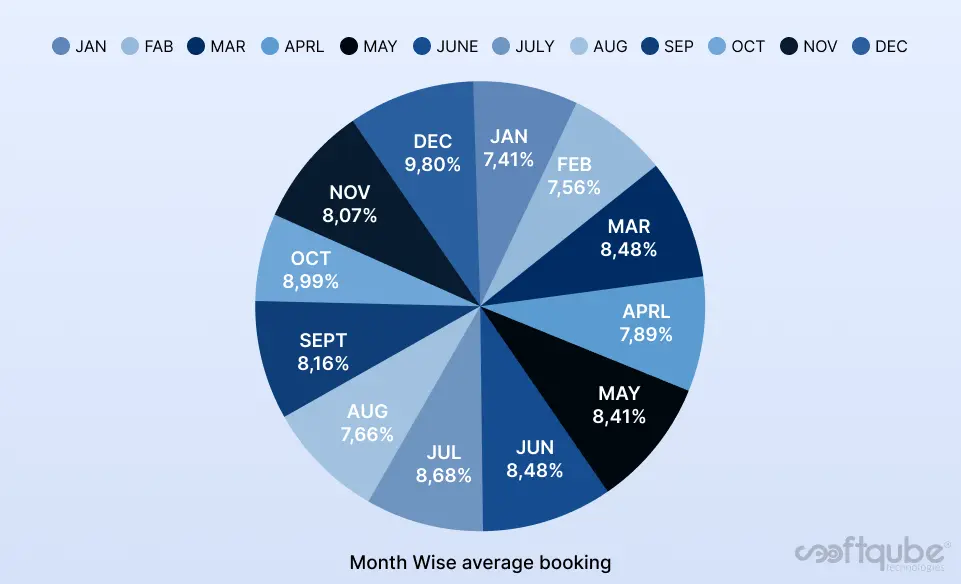
- As we can see usually more bookings are done for December and October for the year 2021 and 2022. That means Room rates was increased as occupancy was increased.
- In following graph we can see trend with total revenue distribution in all months during year.
- It was observed above that bookings were more during October and December month, so revenue during these two months was also high.These can be due to any festival , events or any special occasion in the nearby area which we tried to find out in further analysis.
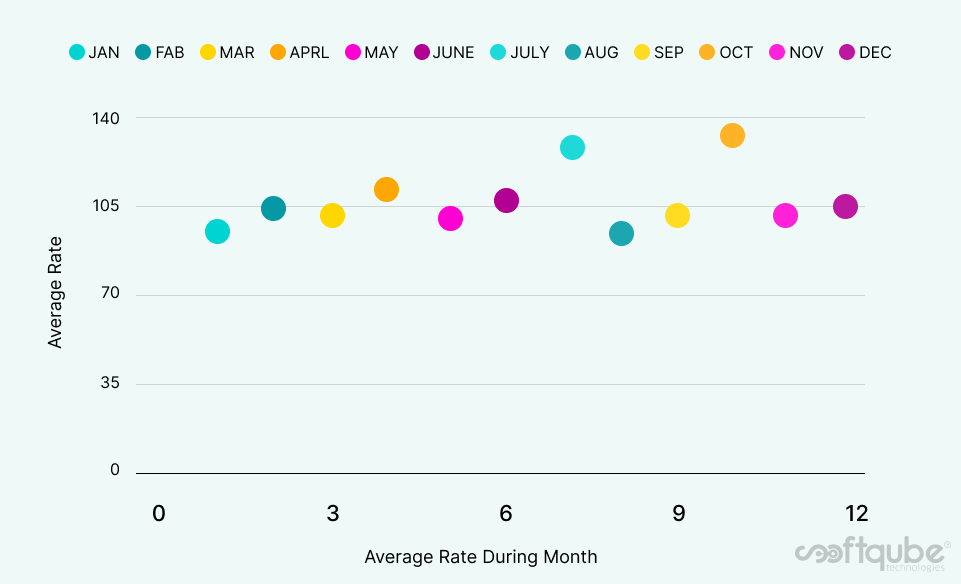
- Lets analyse the relation of revenue with average rate in month.
- We can see the correlation between average rate and revenue, in JAN average rate is about $99 and revenue was around $226949 as following in OCT the average rate is about $130 (highest among all) and average revenue was also heist at $315735.
- Now we have to look at what type of rooms are mostly booked, what was the purpose of that and what are the relation with rates.
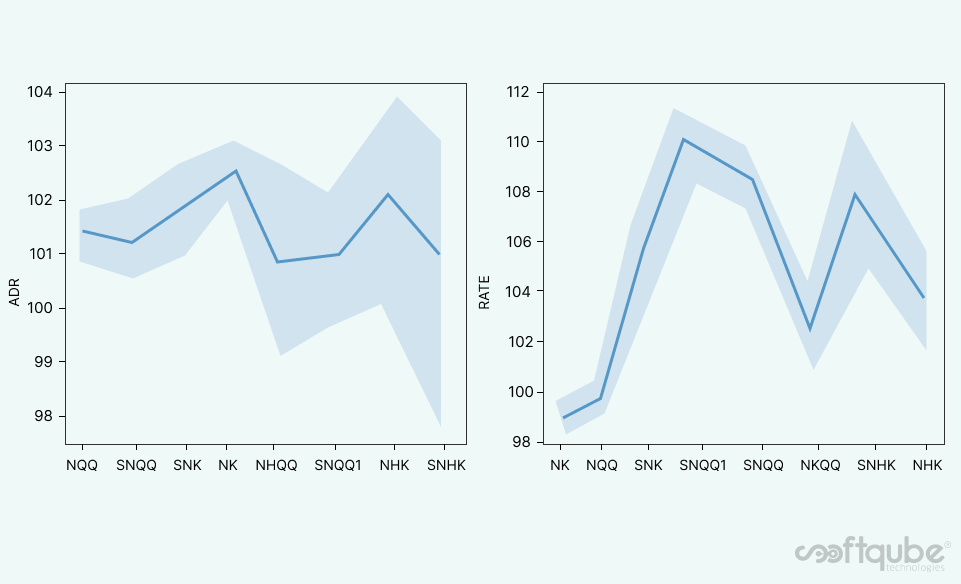
- Most people are likely to book the room with NQQ (non-smoking double queen size bed) 12259 (40%) followed by room NK (non-smoking single king size bed) 9655 (30%) Two least room type are observed as SNHK (suits non-smoking single king size bed with handicapped) 676 (2%) and NHK(non- smoking single king size bed with handicapped) 396(1%).
- Above I found this room type relation with ADR (Average Daily Rate) and Rate, for Rate its interquartile range is thinner than ADR, it means Rate is more tightly related with room type.
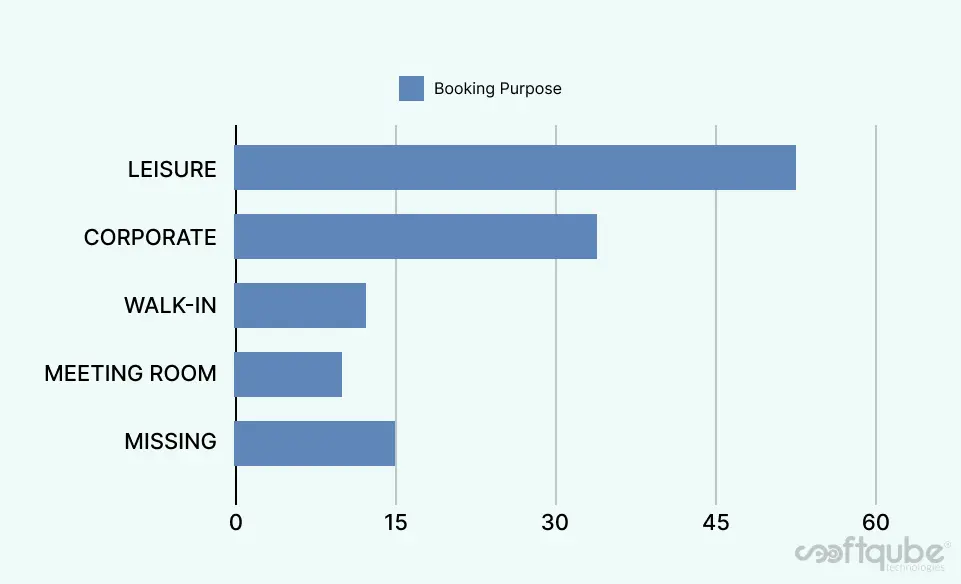
- Look at the ratio of room booking purpose during the years.
- Mostly people are booking room for Leisure(rest) 16236(51%) purpose followed by Corporate Sector(meetings) 11189(35%).So here we can say that people who book room for leisure purposes are going for room type NQQ or NK most of the time. And based on this hotel can set room rates and amenities accordingly.
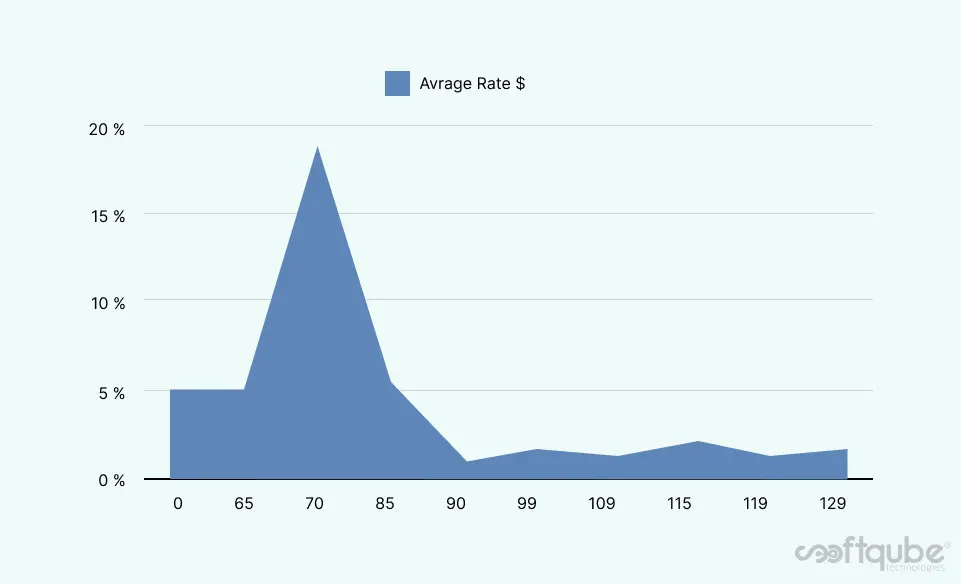
- Here is the range of average rates and we can see the range of 65-85(AVG) is more preferable.
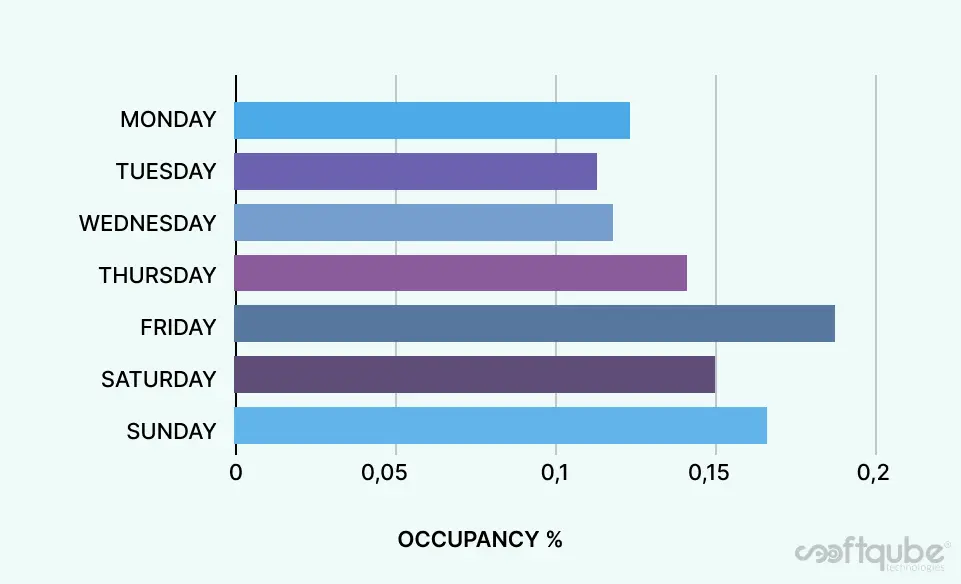
- Friday, Saturday, and Sunday having more occupancy and in respect of positive relation with occupancy rates were also increased; Hence weekends are important for hotels to serve customers accordingly.
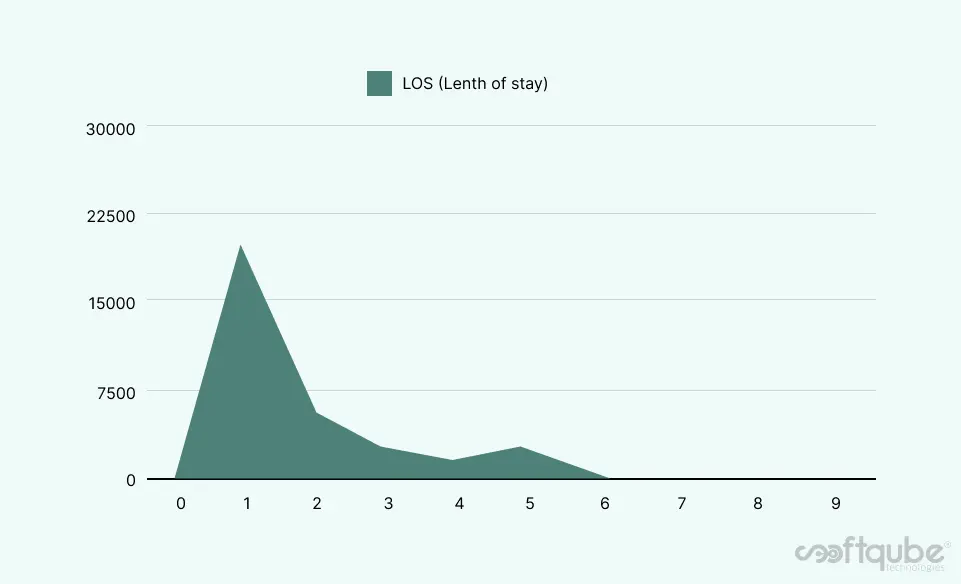
- Same as Occupancy vs. Rates, LOS and Revenue have positive correlation, revenue will increase with total LOS increase; here we can see that 1N,2N stays are more compare to 3,4,5.
- Short range of LOS is more preferable(mostly on weekends ).
- While analysis we found some Outliers also, simply share is some data that stands far out than the standard range, There was oner data point who has LOS of 141 nights.
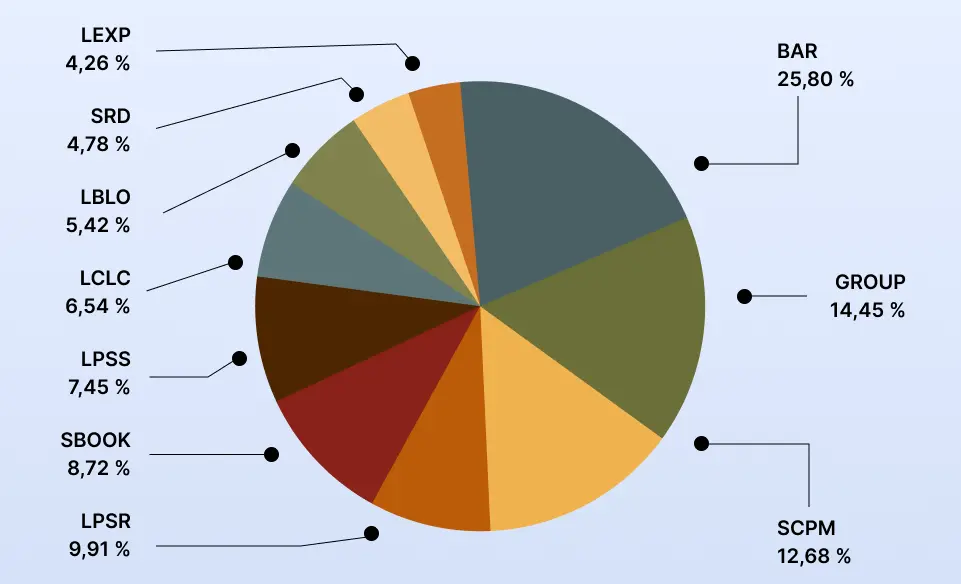
- There is several TrackCode or we can say RateType, all have some
- impacts on rate, out of 36 we select 10 most used track codes here.
- Mostly people have used BAR(Best Available Rate) track code 5716(25%) for booking followed by GROUP and SCPM.
- We also noticed some more relation and patterns in this dataset; here is the short description of that.
- The average difference between ADR and Rate is 0.02%, in ADR average rate is 99$ and average rate was 102$.
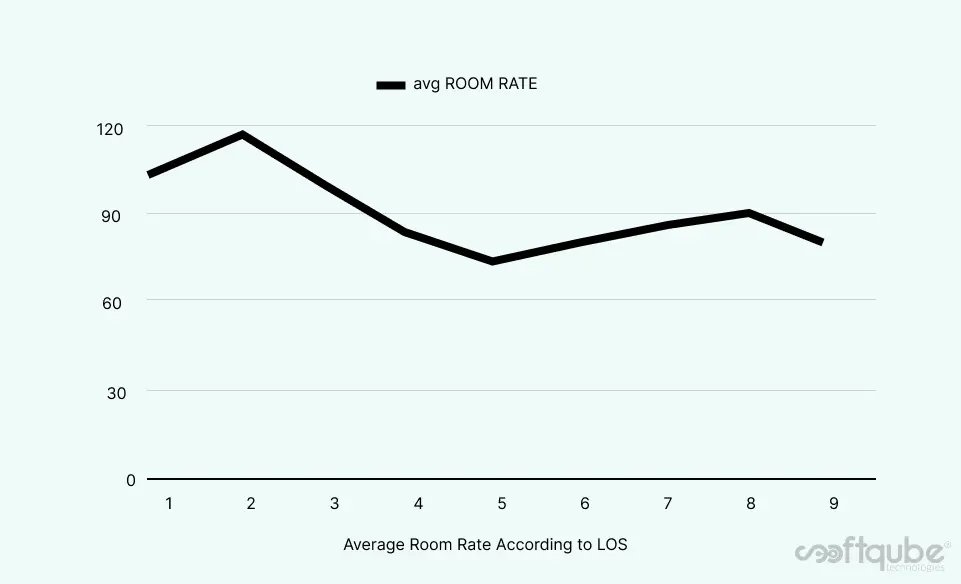
- The Rates per nights depends on LOS; Rates decrease with LOS increase.


Here is the analysis of average occupancy in week.
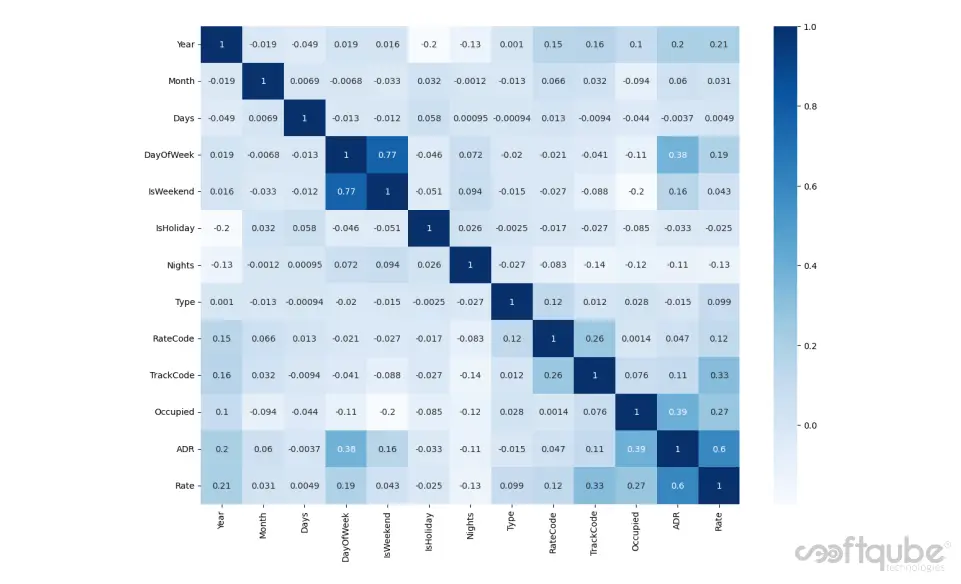
HEAT MAP OF CORRELATION
- A heat map represents these coefficients to visualise the strength of correlation among variables.
- From the graph it is evident that Rate is direct depended on ADR (Average daily rate) , occupancy (how many rooms are occupied) and Day of week; there is indirect dependency also, with weekends, Track code, LOS and Rate code.
- Overall data is corrected with all features and more or less deciding factors in the rate prediction.
MACHINE LEARNING MODELS & RESULTS
The machine learning field is continuously evolving. And along with evolution comes a rise in demand and importance.
There is one crucial reason why data scientists need machine learning, and that is: ‘High-value predictions that can guide better decisions and smart actions in real-time without human intervention’, we feed important features columns to a ML model as a X variable and target column as Y variable and then divided it into training set and testing set in a ratio of 70:30, so we will get training and testing results.
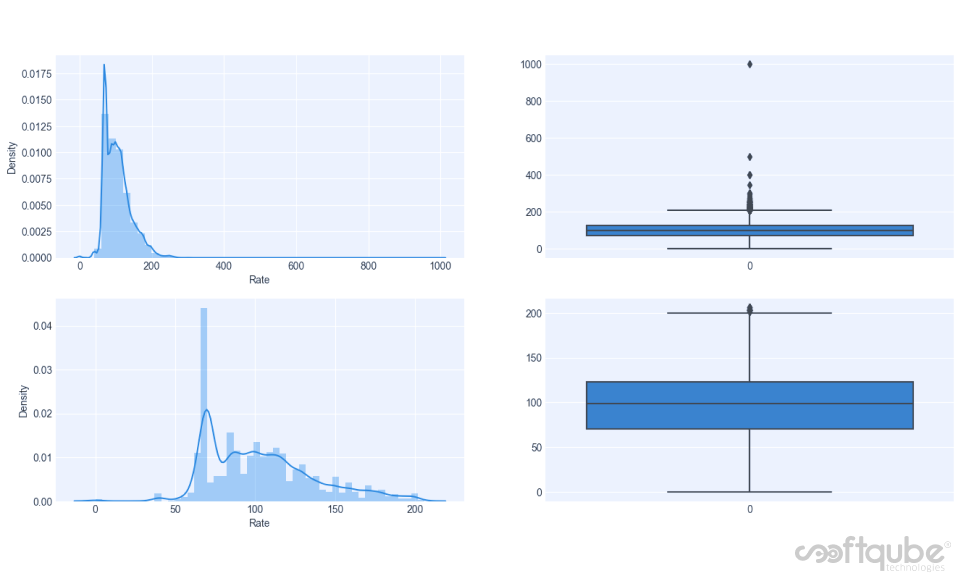
Here we used the linear registration, the Random forest, the Extreme Gradient Boosting(XG boost), and the Decision tree, before giving data to machine learning model, it should be outlier free and normalised, here is the graph of before and after removing of outliers and normalisation.
There is visible difference, before the process target data is more saturated to it’s mean an also have high standard deviation, After processing it was well distributed and have well defined interquartile range and outliers free, finally ready to feed to ML model.
Evaluation Metrics

R2 score is the difference between the samples in the dataset and the predictions made by the model.
MAE is the mean of the absolute error values (actuals – predictions)
MSE is a simple metric that calculates the difference between the actual value and the predicted value (error), squares it and then provides the mean of all the errors.
RMSE is the root of MSE and is beneficial because it helps to bring down the scale of the errors closer to the actual values, making it more interpretable.
Here is the Evaluations metrics of ML models, model’s good accuracy is identified by less difference between training and testing accuracy and with less score of errors.
Based on this matrix, we chose XGB Regressor as the best algorithm for the model. There is around 14% of error because there is lot of other factors to consider while predicting rates and some are unpredictable but we’re working cleverly on this and will develop more accurate ML model.
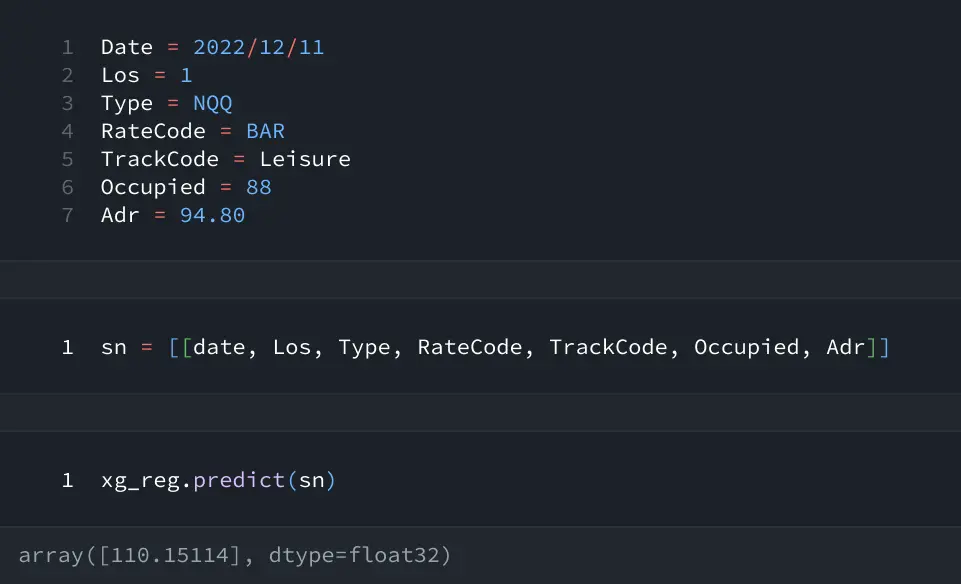
Here is the trained model on which inputing required Parameters will predict Rate ($110).
