SUCCESS METER
Project Scope
The project scope of work for the data analysis and processing system for restaurant operations involves developing a comprehensive solution to collect, process, analyze, and display data, transforming raw data into meaningful insights. The system will gather data from direct user inputs ensuring accurate and timely collection. Data will be processed through cleaning, transforming, and categorizing to prepare it for analysis. Real-time processing will provide immediate insights for time-sensitive data, while batch processing will handle less urgent data at scheduled intervals.
The analysis component will use statistical methods and algorithms to uncover patterns and trends, focusing on key performance indicators (KPIs) like Occupancy Percentage (Occ%), Average Check (AC), and Revenue Per Available Seat Hour (RevPAS).Benchmarking and comparison tools will enable restaurants to conduct comparative analysis against competitors, facilitating strategic decision-making. The system will include customizable KPI management for setting, monitoring, and achieving performance goals, supported by real-time monitoring, historical data analysis, and actionable insights. Additionally, reporting and exporting features will offer dynamic data visualization, automated report scheduling, and multiple format exporting options. This integrated approach aims to enhance operational efficiency and strategic planning in restaurant management.
Objectives
Why this Application
was
Developed
One
Data Analysis and Processing
Data Analysis and Processing of the system architecture would describe the methods and technologies used to collect, process, analyze, and display data. This ensures that users get meaningful insights from the raw data generated by restaurant operations.
two
Benchmarking and Comparison Tools
The "Benchmarking and Comparison Tools" component of a system like the "Success Meter" is central to its value proposition. This section of the system is where the gathered and processed data is utilized to perform comparative analyses that can guide strategic decision-making for restaurants.
Three
KPI Management
The KPI Management module within a platform like "Success Meter" serves as a critical framework for setting, monitoring, and achieving specific performance goals. It turns strategic objectives into measurable metrics that a restaurant can use to assess its operational success.
Typeface and colors
Inter / Bold
Preview
Inter / Semi bold
Preview
Inter / Medium
Preview
Inter / Regular
Preview

The quick brow fox
The quick brow fox
The quick brow fox
The quick brow fox
#6366F1
#FFFFFF
#1B243C
#070F22
Platform and Technologies


SYSTEM USERS
"Success Meter" is designed for a diverse range of dining establishments including restaurants, cafes, bistros, diners, coffee shops, eateries, delis, food trucks, taverns, cantinas, steakhouses, buffets, cafeterias, and lounges. Our system empowers these businesses to seamlessly compare their data and sales performance, enabling informed decisions and driving growth. Elevate your establishment with "Success Meter" and achieve unparalleled success.


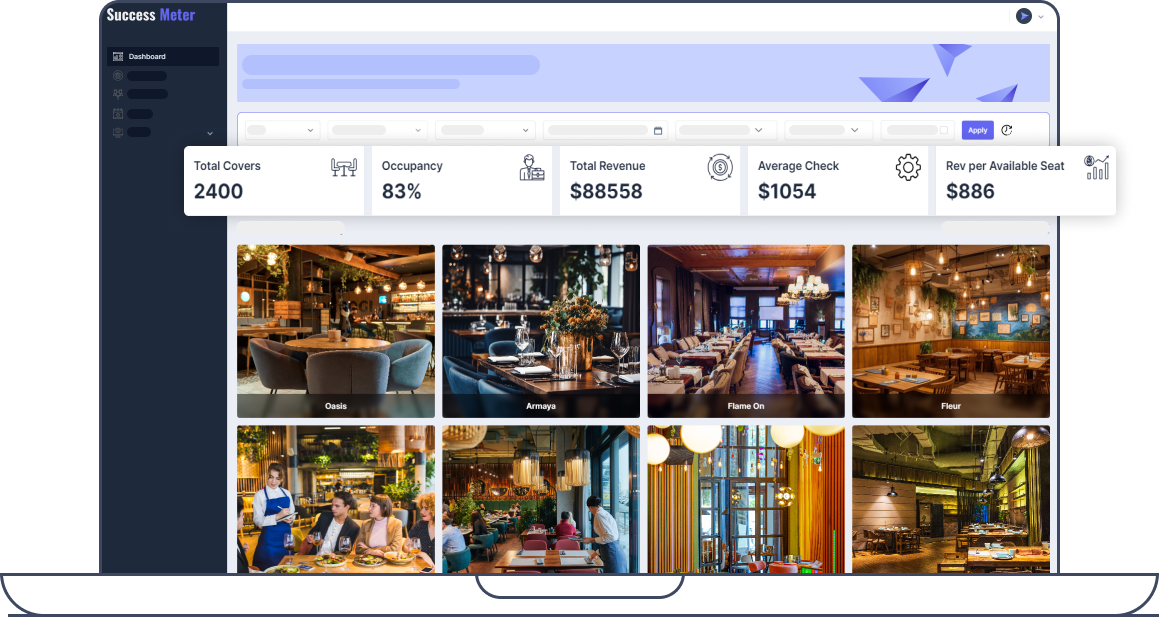
Dashboard

User can view List of restaurants, multiple figures like total covers, occupancy, total revenue, average check, Revenue per available seats & filters.
KPI Index Graphs
The snapshot area contains daily KPI index graphs that restaurant users can view. These graphs show the MPI, OCC%, current rank, and rank from last year.


Average Bar Chart
Dining Establishment The graph below allows the user to view their average revenue per filled occupancy. The user has the option to compare Own Average Check, Compset Min/Max Average Check, and Change with respect to the previous year.
Business Overview
Under the snapshot sentient business overview graph, restaurant users may examine their entire business overview based on OCC%, Revenue, Compset OCC%, Compset Min Revenue, and Compset Max Revenue.

Restaurant REVPAS Graph
These graphs allow users to view their revenue per available seat in their restaurant. Users have the option to compare their REVPAS, Compset REVPAS, and Change with respect to the previous year's REVPAS and Compset REVPAS.

Revenue and Occupancy
Restaurant Users can see graphs showing their revenue and occupancy together with their covers and compset covers, changes to their covers and compset covers, and annual changes to their revenue and compset revenue.


Restaurant List
From this menu, users can add new eateries and examine a list of restaurants along with some basic information about each one.
Competitor List
From this option, the user can add new competitors and browse a list of competitors along with their basic information.


Events
From this menu, the user can create new events and examine a list of events along with their basic information. Users can filter their company data based on event dates and event weeks by adding events. An event can also be set by the user to repeat.
Email Setup
To receive reports automatically, users can provide their official email address. If a user forgets their password, these email addresses can provide links to reset them.


Scheduler for Reports
Restaurant Report scheduling allows users to set up reports based on report type, weekdays, frequency, and kind of cuisine. On the chosen day or days, the user will receive this report at their official email address.

Setup of Roles
Restaurant Using user management, the user can add additional users, such as the manager and the receptionist, and assign them certain roles. The items listed in each user role are the only ones that they can access.

Restaurant KPI
Configuration On each index, the user can configure their preferred KPIs according to their plan. The user-specified target KPI will appear on snapshot graphs in the colors green (above target) and red (below target).

Dashboard

The dashboard provides the admin user with a comprehensive overview of the system. able to see the entire list of (Brands, Clients, Restaurants, Competitors). can observe the monthly user graph on boards. Able to see both New and Recurring Subscriptions. has access to recent renewals and cash flow.

Restaurant List
Based on their specific clientele, the system's list of restaurants may be viewed by the administrator, who can also access their basic information. From this component, the admin user can control the status of each restaurant.
Client List
The admin user can manage the status of each client's account and add or update new clients from this part.


Subscription
This section allows the admin user to create and manage new subscription package types in addition to managing existing subscription packages.
Conclusion
The development of Success Meter by Softqube Technologies marks a significant advancement in the restaurant industry’s approach to revenue management and benchmarking. By integrating sophisticated data analytics tools, Success Meter enables restaurants to transform raw data into actionable insights, improving operational efficiency and strategic decision-making. This platform not only enhances real-time monitoring of key performance indicators like MPI, ACI and RGI also provides valuable benchmarking tools for comparative analysis. Softqube’s expertise in data analytics and its commitment to innovation have resulted in a robust solution that empowers restaurant owners to make informed decisions, drive revenue, and achieve sustainable growth.
Testimonials
Working with Softqube Technologies on the Success Meter project has been a game-changer for our restaurant management operations. Their expertise in data analytics and commitment to delivering high-quality solutions have significantly improved our ability to analyze and manage revenue. The platform’s real-time monitoring and comprehensive benchmarking tools have transformed our strategic decision-making process. We are extremely satisfied with the results and look forward to continued success with Softqube.

Saurabh Kumar
CEO, Success Meter Pty Ltd


Latest Insights

Block Chain
How crypto mining helps the real world!
Table of Contents Transaction Validation Securing the Network Decentralization Preventing Fraud and Ensuring Immutability Consensus Mechanism Final Thoughts: Why Blockchain & Crypto Matter? Mining strengthens the blockchain network by validating transactions and securing the networks. Cryptocurrency is a digital or virtual currency that uses cryptographic techniqu....

Hari Patel | 06 Feb 2025
Hybrid Cloud Analytics: The Future of Scalable and Intelligent Data Management

Hari Patel | 13 Jan 2025
Harnessing Data-Driven Decision Making: A Guide For Modern Businesses

Hari Patel | 20 Dec 2024
Data Analytics 101: How Small Businesses Can Turn Insights Into Growth

Hari Patel | 13 Dec 2024
Global Presence

UNITED STATES (H.O)
Georgetown TX-78626

UNITED STATES (B.O)
Lansdale, PA-19446

INDIA
Ahmedabad, GJ-382350

AUSTRALIA
Melbourne

NAMIBIA
Windhoek


Skype


Let’s Work together!
"*" indicates required fields